Diamond Spread Score, A Simple Looks Bigger Metric
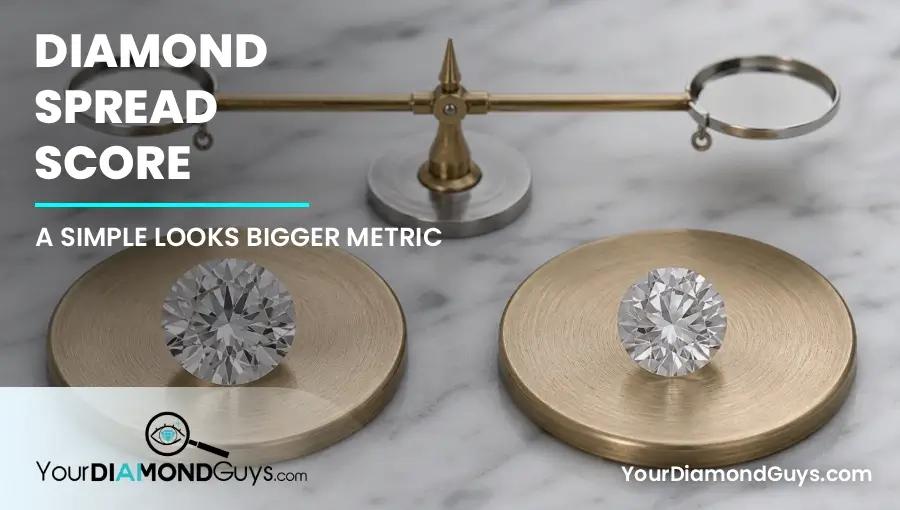
Spread score asks how much visible diameter you receive for the weight you buy.
By Josh Allen, Co-Founder of YourDiamondGuys.com. Fifth generation diamantaire with 30+ years in the global diamond trade. Former supplier to Tiffany & Co., Cartier, and Harry Winston.
How we evaluate proportions: We build a fair peer group by shape, ratio, and carat neighborhood, calculate the face up comparison, then inspect depth and light return. A spread score exposes hidden weight. It does not grade beauty.
My version stays simple. Compare the face up footprint of a diamond with the median footprint of similar stones in the same shape, ratio band, and carat neighborhood.
A score should expose hidden weight, not hide judgment behind a black box. If you cannot explain the inputs, do not let the badge choose the diamond.
For natural diamonds, start with GIA. GIA includes weight ratio in round brilliant cut assessment, so buyers can make the idea practical by comparing millimeter spread inside a tight peer group.
The Short Answer
For rounds, divide the diamond's average diameter by the median average diameter of comparable rounds, then multiply by 100. For fancy shapes, compare length × width with the median length × width of stones that share the shape and a narrow ratio band.
A score near 100 means typical spread for that peer set. Above 100 means more footprint. Below 100 means less. The score does not grade light return, outline quality, durability, or beauty.
Build A Fair Peer Group First
The comparison group decides whether the score means anything. Keep shape identical. Keep carat within about five percent when inventory allows. For fancy shapes, keep ratio close enough that you are not rewarding length at the expense of width.
Use at least five peers and prefer ten or more. Remove obvious data errors, but do not remove smaller stones just because they lower the median.
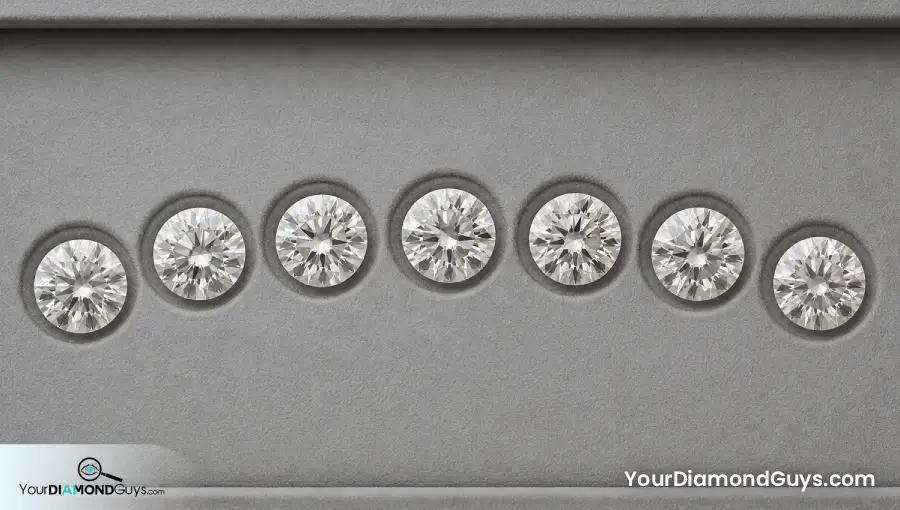
A spread score only means something when every stone belongs in the same peer group.
The measurements guide gives you the raw values. The ratio guide keeps fancy shape comparisons honest.
Two Useful Spread Calculations
Round diameter score equals average diameter divided by peer median diameter, multiplied by 100. This avoids pretending that a circle needs a rectangular area formula.
Fancy footprint score equals length × width divided by peer median length × width, multiplied by 100. The rectangle overstates the true outline area, but it works as a consistent proxy within the same shape and ratio band.
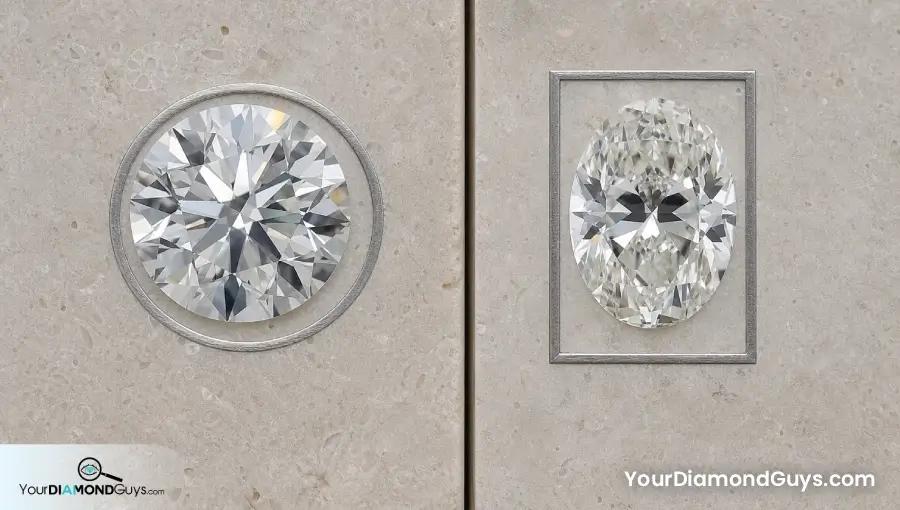
Use average diameter for rounds. Use length times width within the same fancy shape and ratio band.
| Score | Plain meaning | Next check |
|---|---|---|
| Below 97 | Noticeably small for the peer group | Depth, girdle, pavilion, and price |
| 97 to 99 | Slightly tight spread | Confirm whether cut beauty earns it |
| 99 to 101 | Typical peer spread | Judge cut and outline |
| 101 to 103 | Strong visible footprint | Check shallow leakage or narrow outline |
| Above 103 | Unusually large footprint | Verify data, ratio, girdle, and light return |
Why Bigger Is Not Always Better
A shallow round can post a high diameter score and still leak light. A long narrow oval can post a large rectangular footprint while losing balanced belly and brightness.
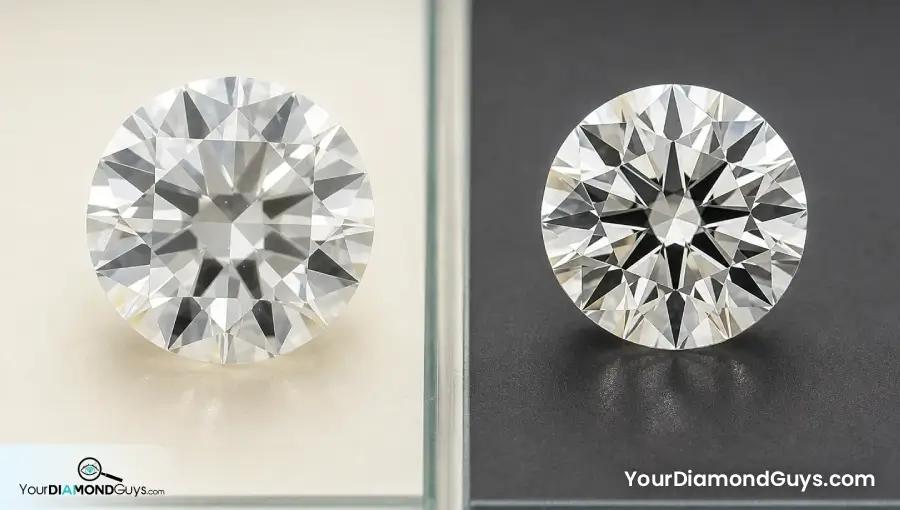
More diameter does not help when the extra area looks pale. Spread gets you to the video, not past it.
The score tells you where to look. High spread needs the depth percentage check and a neutral video. Low spread needs an explanation from girdle, crown, pavilion, outline, or price.
I would rather buy a score of 100 with excellent performance than a score of 104 with a pale center. Visible area only helps when that area looks good.
Keep The Metric Transparent
Save the peer list, the median, and the date. Inventory changes, so a live market median can move. A fixed reference chart can work too, but the chart needs a disclosed source and shape assumptions.
Never mix millimeters and carats in one unexplained proprietary score. Never compare an emerald cut with a cushion simply because both are rectangular.
This metric works best as report only triage before you apply the proportion red flags checklist and visual review.
How I Use Spread In A Shortlist
I score the shortlist after I remove stones with the wrong shape or ratio. Then I inspect the top and bottom outliers first.
A low score can still win when the cut is exceptional and the price reflects the footprint. A high score stays only when light return, outline, girdle, and durability remain sound.
A Spread Score Example
Five comparable 1.00 carat rounds have a median average diameter of 6.40 mm. One candidate averages 6.24 mm. Its diameter spread score is 97.5.
That does not automatically reject it, but it flags a real size loss. I check total depth, girdle, pavilion, and price. If nothing exceptional explains the loss, I choose a better distributed stone.
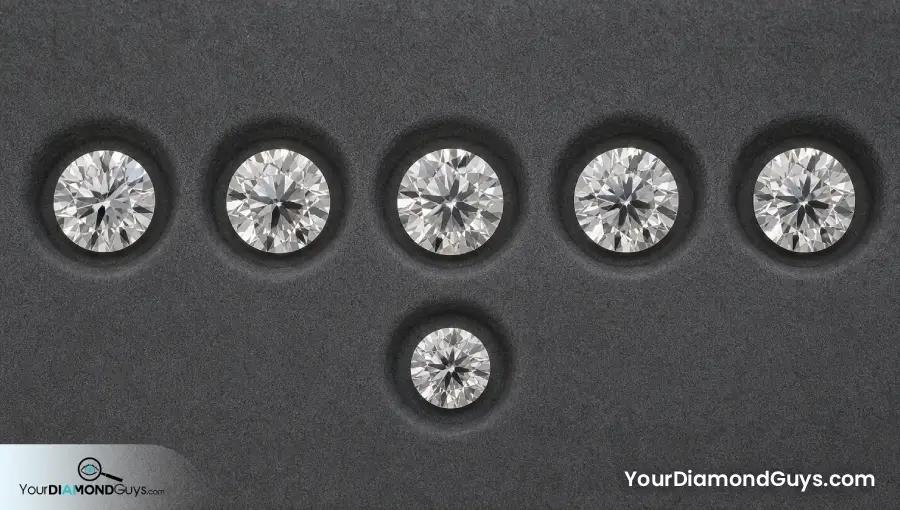
The smaller candidate is the outlier. Now check depth, girdle, pavilion, and price before you reject it.
Mistakes I Would Avoid
- Calling the score a laboratory cut grade.
- Comparing different shapes in one peer set.
- Ignoring ratio when scoring fancy shapes.
- Rewarding shallow spread before checking light return.
- Using a proprietary badge without knowing the formula or reference group.
Questions To Ask Before Buying
- What formula and peer group created this spread score?
- Are the comparisons the same shape, ratio band, and carat neighborhood?
- Does the GIA report confirm the listed measurements?
- Does strong spread come with leakage or an awkward outline?
- Does the price reflect any visible size loss?
Where To Compare The Proof
Affiliate disclosure: Your Diamond Guys can earn a small commission if you buy through a partner link. It does not change what you pay or which diamond we recommend.
Build a peer set from listings on Blue Nile and Ritani. Export the measurements, calculate the median, and use the score to identify which videos deserve your attention first.
The Spread Tradeoff I Would Choose
Use a transparent peer based score. Keep 99 to 101 as typical, then investigate the outliers instead of treating the number as a winner badge.
Spread measures visible footprint. Cut quality decides whether that footprint deserves your money.
If you want another set of eyes on the stone, book your free consultation with Your Diamond Guys.
Keep Spread In Its Lane
The face up spread and hidden weight guide covers the broader size decision. Build the metric from the report measurements, check depth percentage, and make sure a thick girdle is not carrying paid weight.
The diamond measurements and proportions hub keeps spread connected to depth, angle pairs, outline, and actual light performance.
The "Spread" Trap: Why Your Diamond Looks Big But Has Zero Sparkle
Questions? Reach out directly for a free consultation, or drop them in the Diamond Buyers Academy community — Rob and Josh answer personally.
Questions Buyers Ask Us
*Some links on our site may earn us a small commission at NO EXTRA cost to you, helping us keep our content free*